

By Subhradip Kar (Geo Lead – Data & Analytics Practice)
1. Synopsis
Companies are continuously striving to democratize and leverage data optimally for decision-making. Actionable insights derived from the data can differentiate and help with the wins. Reports are a key mechanism through which business users consume insights while making critical decisions. However, over time, organizations tend to produce and accumulate a huge number of reports that are counter-productive and extremely challenging. Business users drown in a deluge of information that defeats the core purpose of the reports. Today, most organizations are using multiple BI tools with overlapping capabilities that deliver reports lead to an additional set of challenges.
To solve these challenges, it is imperative to define a strategy for report rationalization and adopt a structured approach across different business units and functions. While the reporting environment is streamlined, the ultimate focus should be on establishing a modernized NextGen reporting environment that benefits the organization. This whitepaper covers details around how such strategies should be defined and proposes a structured framework.
2. Industry Background – Impact of Data & Insights
In today’s competitive and fast-paced digital environment, companies differentiate by focusing on five core themes:
- Driving Customer Centricity – amplify data-driven personalization to augment customer experiences, consistent and contextual experiences across channels by pushing data insights in real-time
- Improving Efficiency and Reducing Cost – automation and process improvement, reduce technology debt, data engineering excellence & establishing advanced data platforms to integrate all types of data and drive insights
- Innovating to establish New Revenue Streams – differentiated products and services, partnerships to augment niche capabilities and marketplaces across ecosystems for monetizing data
- Better Managing Risk – stronger data governance policies and controls, flexible platforms to embrace and address evolving regulations
- Transforming Operating Models – promote seamless Business-IT alignment, Agile and DevOps based delivery, models
A common denominator driving each of these themes to deliver value is “insights” that power data-driven decisions.
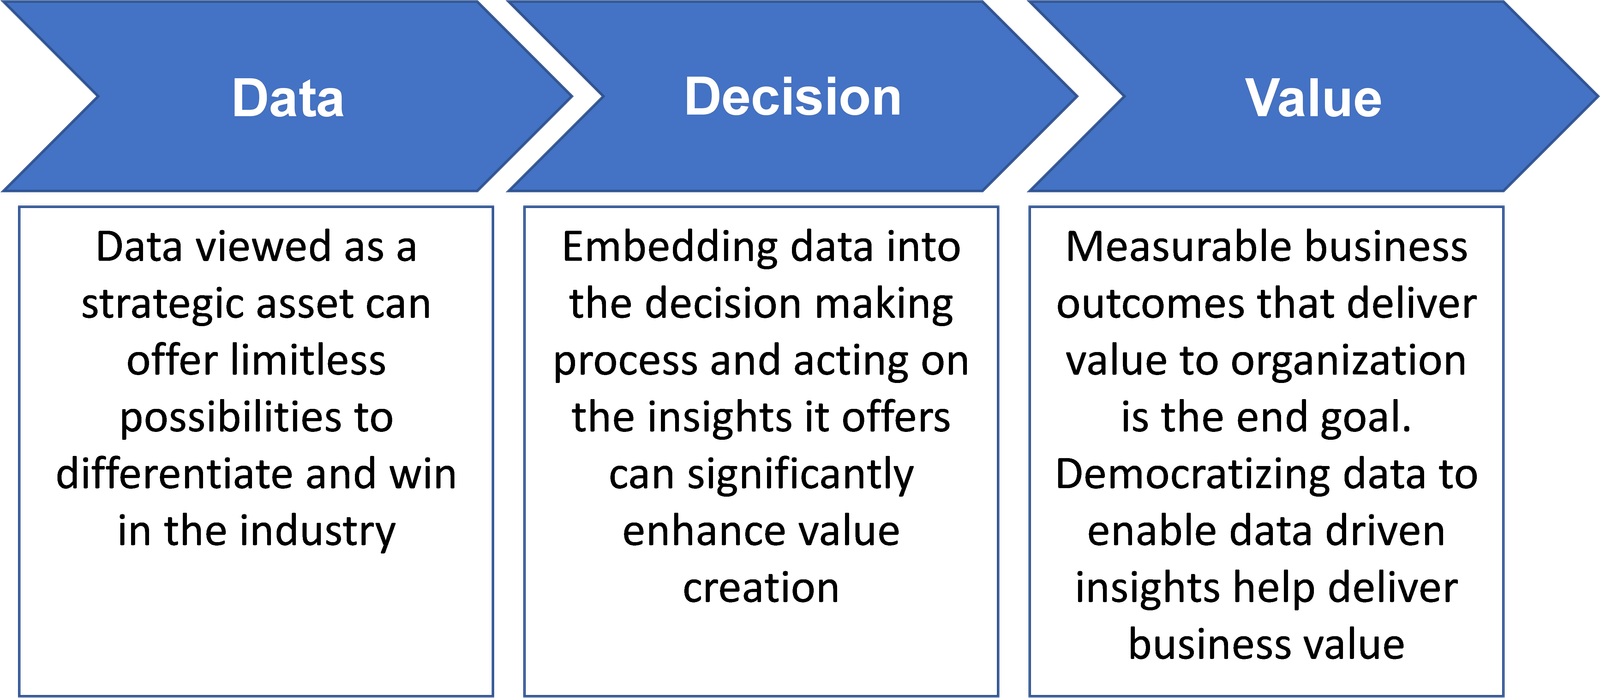
Diagram 1 – Data-Driven Decision Making Value Stream
There are different data consumption patterns that enable “insights” such as Interactive Reporting and Data Visualization, Data Discovery and Exploration, Advanced Analytics, Search, etc. Among these, reporting has been around for a very long time and will continue to play a significant role in the foreseeable future. The typical challenge that most companies face with reports is a plethora of reports that are difficult to manage and offer inconsistent insights hampering the decision-making.
3. Business Need for Report Rationalization
Companies need to transform into “insights-driven organizations” so that they can create an impact on each of the five core themes to differentiate and outperform their competitors. However, most companies are struggling to effectively democratize data and deliver insights thereby impeding their progress towards transforming into an insight-driven organization.
- Data Engineering – data deluge, new age data, varied integration patterns, etc. adds complexity to data ecosystems
- Technology Debt – legacy data estate and tooling creates a roadblock for enabling new age data consumption
- Redundancy – replication of data, models, reports, etc. across business units with lack of reuse creates inefficiency
- Usability – a deluge of reports, different personas, lack of self-service, and data exploration capabilities hinders usability and decision making
- Data Governance – lack of visibility into data quality, lineage, metadata, etc. obstructs usability and trust in data
- Data Security – fine-grained security and access controls on data at rest and in motion, PII data protection, etc. are imperative to secure and manage data privacy
- Cost of Operations – higher costs due to ineffective integration, lack of modularized DevOps processes, etc.
While it is important to mitigate each of these challenges, our focus is on defining an approach for resolving the redundancy and usability challenges with reports. Lack of adequate governance further exacerbates the problem leading to redundancy and duplication. Companies also end up owning multiple BI technologies with overlapping capabilities leads leading to increased effort, reduced efficiency, lower user adoption, and higher total cost of ownership (TCO).
There is an urgent need to rationalize and streamline the existing reporting landscape and migrate to a modernized NextGen reporting ecosystem.
4. Approach for Report Rationalization
There are primarily two strategies to consider for report rationalization and migration:
- Strategy 1 – Migrate first and rationalize later
- Strategy 2 – Rationalize first and migrate later
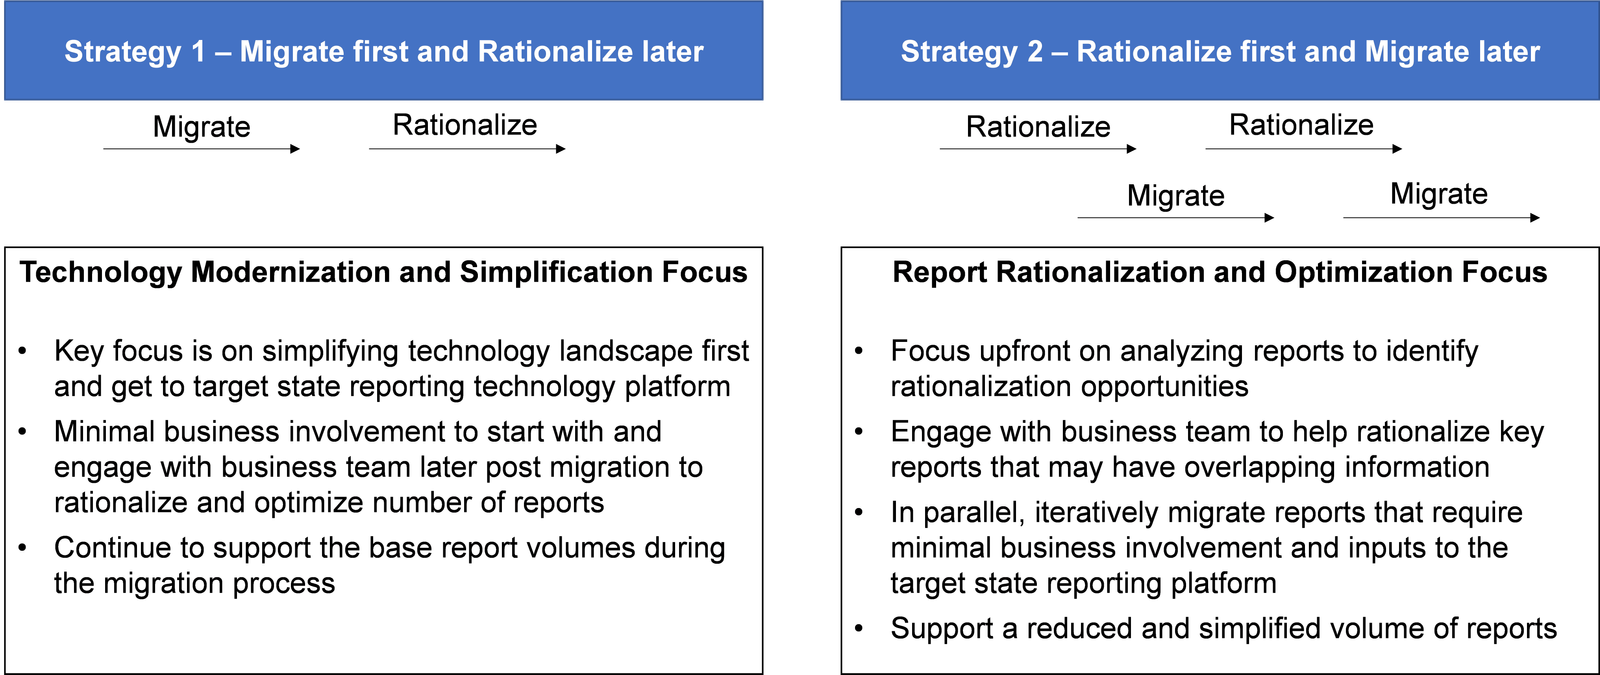
Diagram 2 - Report Rationalization and Migration Strategies
Each situation is unique and needs to be assessed prior to finalizing a particular strategy. There are several factors to consider before choosing a specific strategy
- Existing TCO, the business case for report rationalization and migration associated with the ROI plan
- Number of reports and relative report complexity in the current state environment
- Level of complexity involved in migrating reports to the new reporting platform
- The severity of technology debt with the existing reporting platform
- Level of business engagement anticipated and associated business commitment
- Dependencies based on company-wide initiatives
Irrespective of the strategy chosen, we must adopt a structured approach for analyzing the existing reports and determining the report transformation strategy. A holistic approach for report rationalization considers both a “technical” and a “functional” assessment of the current state reports to determine the report disposition for the target state.
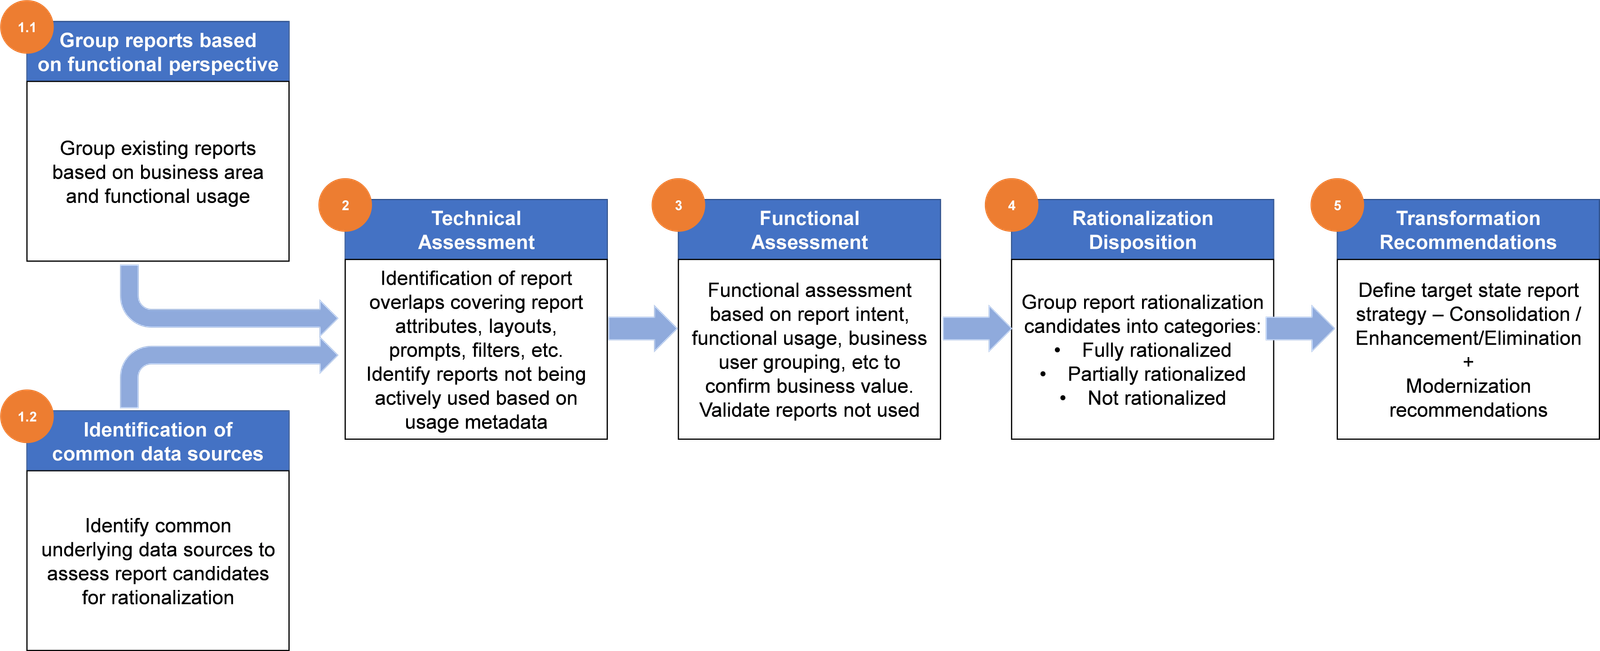
Diagram 3 – Report Rationalization Approach
Technical assessment of large reporting environments with hundreds and thousands of reports can be a daunting and effort-consuming task if planned manually. It is better to automate part of the technical assessment using accelerators that can consume and understand report metadata and use it to compare reports and determine the percentage of overlap. Such accelerators allow reports that need to be compared to be grouped by sources, functional areas, semantic layers, and choosing a specific set of reports. Such co-relation and overlap analysis can help segregation.
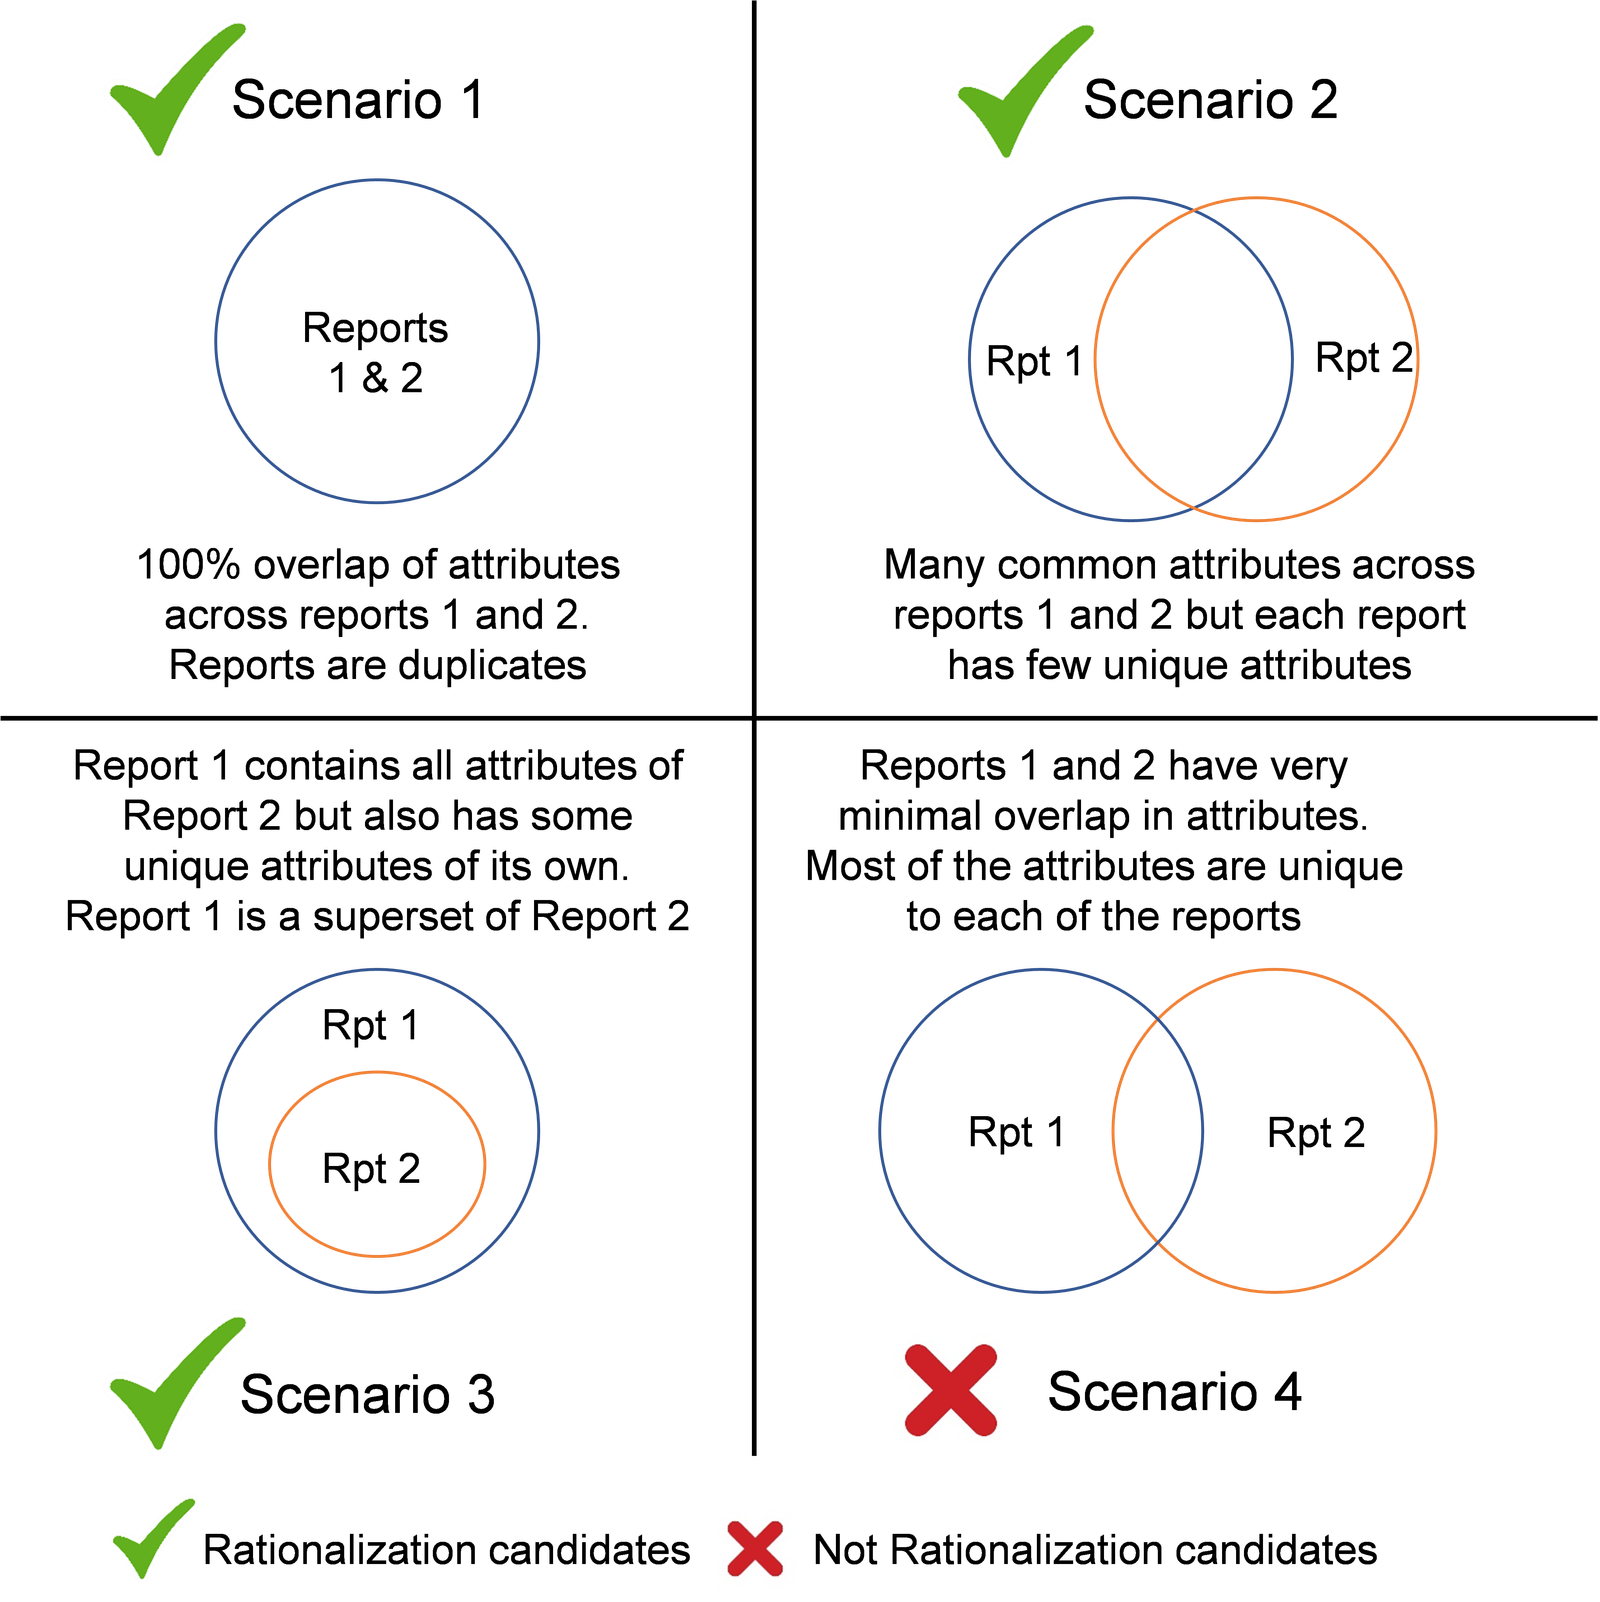
Diagram 4 - Report Rationalization Scenarios
Similarity across reports the level of overlap can be determined by:
- Database attribute overlap % - overlap in the database attributes used in the report query as well as the rendered report
- Filters overlap % - overlap in the database attributes used in the report filters
- Metrics overlap % - similarity in the metric names and the metric definitions (for metrics computed at the report level)
Based on the nature and type of reports in a particular environment, these three parameters can be combined into a weighted score to indicate the extent of report similarity and overlap e.g.
Report Correlation Index Score = 50% of Database attribute overlap + 30% of Filter overlap + 20% of Metric overlap
A threshold of 75% can be set and any correlation index score higher than the threshold score is a good report rationalization that can be further analyzed.
This methodology provides a structured and automated approach for conducting technical assessments of the existing reports. When we have many reports to be analyzed, this methodology quickly narrows down the focus on the cross-sections that need to be analyzed further. This limits the level of manual analysis effort while giving a good view of the reports to be rationalized. The output of the technical assessment becomes a key input into the business assessment exercise. Since there is already a set of reports that have been confirmed for rationalization, these reports do not need to be included in the business assessment. The business assessment can focus on reports where report business intent, functional usage and grouping needs to be confirmed with the business. This helps focus the business engagement on important areas and optimizes the time required from the business as part of the report rationalization analysis.
5. Implementation Details
We recommend an iterative 3-phased approach for report rationalization implementation and migration initiative to modernize and transform the organization. The report rationalization and migration phases can be managed iteratively by reviewing and assessing the different approaches to determine the best-suited strategy
Once the rationalization and migration phases have been completed and streamlined, the focus shifts to modernizing and transforming the reporting ecosystem with a focus on an insight-driven organization. At this stage, it is important to determine the specific newer capabilities that are needed to deliver additional value to the business. While there are many options to consider, alignment across the Business and IT teams are crucial to define a roadmap of the prioritized capabilities.
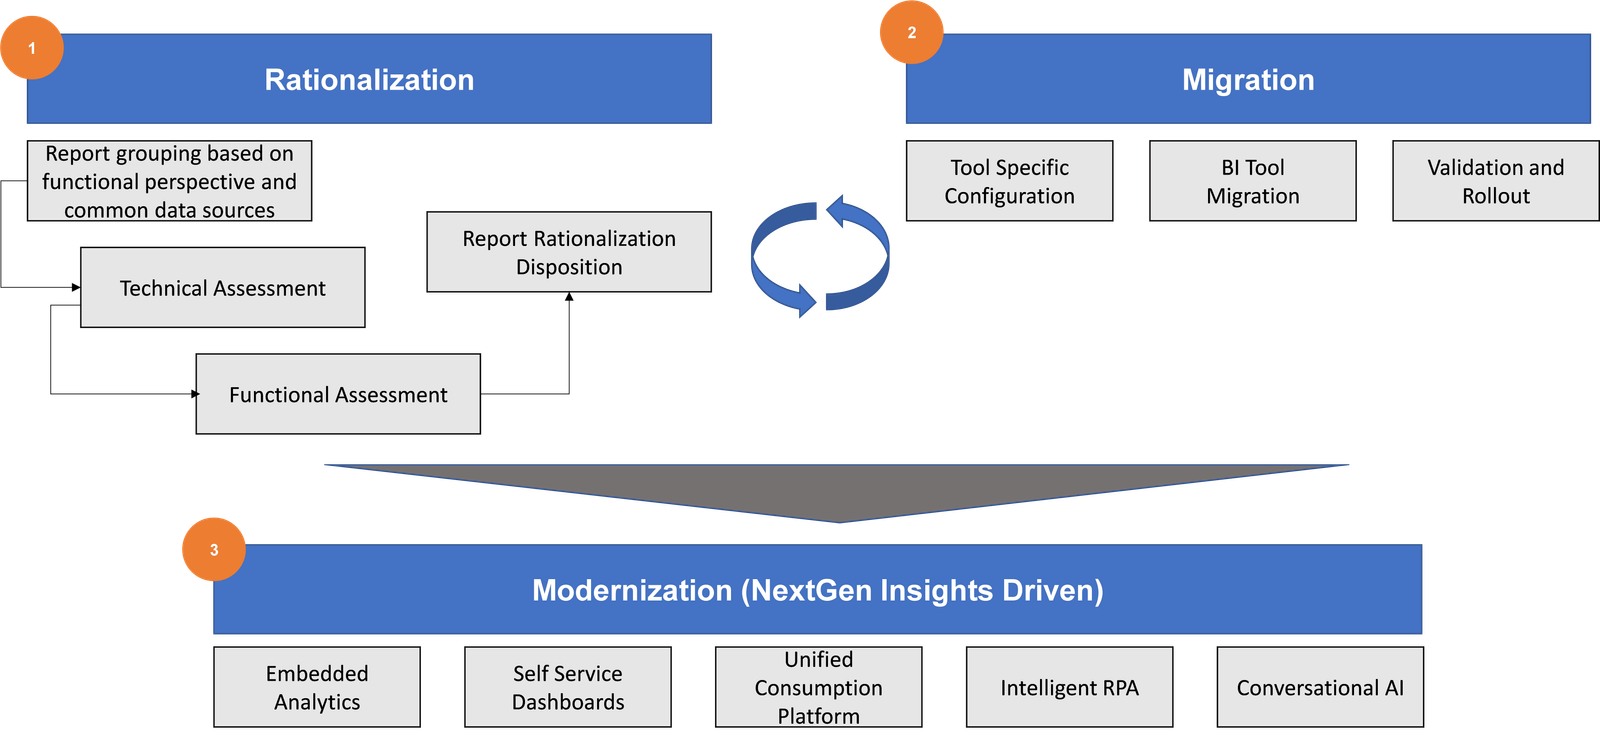
Diagram 5 – Implementation Approach
6. Outcomes and Benefits
Report rationalization, migration, and modernization initiatives offer many benefits:
- Improving decision-making abilities – streamlining reports, eliminating redundancies, standardizing reports, promoting reuse, and aligning reports to specific business insights improves the quality of decision-making
- Amplify business user experience – reports that are better aligned to various business user personas, provide more engaging visualization and consistent metrics and the KPIs improve trust, adoption, and overall user experience
- Enhance processes and standards – such initiatives provide an opportunity to revisit and improve report related standards and delivery processes
- Establish foundation for a future ready solution – a modernized NextGen reporting solution enables data and information to be further capitalized amplifying its value to the organization
- Institute stronger consumption governance – instituting clear ownership around data, metrics and reports enables an understanding of what, how and who uses the information for decision-making. This allows data to be democratized while managing control and adhering to regulations.
- Reduce total cost of ownership (TCO) – reduction in the number of reports, rationalization of BI tools, improved processes, use of accelerators, etc. all help in reducing the TCO
7. Coforge Value Proposition
Coforge has a considerable experience across various BI tools and multiple clients across industries partnering with them on their BI and reporting initiatives. We provide end-to-end BI services from BI strategy and roadmap definition, BICOE setup and operationalization, BI tool and report rationalization, BI development, and support. Coforge has frameworks, methodologies, accelerators, and jumpstart solutions that can be leveraged to improve quality, reduce risk, and improve time to market for client engagements.
8. Conclusion
While the initiative to streamline and rationalize an environment with different types of reports is daunting, embracing a holistic strategy and a structured framework with automation accelerators, the effort intensive tasks go a long way in ensuring success and delivering timely benefits. This helps establish a solid foundation for the transformation that is needed to move towards a data native digital native organization.